217M
Hiring
Sergei Kriger
A chart with the information about how many apples were sold.
Minimum apples 2 kg was sold on July 03.
The goal to sell 4 kg was achieved on July 03 and July 05.
const tmpl = "Minimum apples {{WEIGHT}} kg was sold on {{DATE}}."<svg role="img" alt="Minimum apples 2 kg was sold on July 03.">...</svg>
const tmpl = "Minimum apples {{WEIGHT}} kg was sold on {{DATE}}."<svg role="img" aria-label="Sales statistics" aria-describedby="chart-desc"><desc id="chart-desc">Minimum apples 2 kg was sold on July 03.</desc>...</svg>
aria-label vs
alt
3 kg of apples, 3 kg of bananas, 1 kg of oranges was sold on July 01 with total transaction value of 19 €. 4 kg of apples, 3 kg of bananas, 5 kg of oranges was sold on July 02 with total transaction value of 38 €. 2 kg of apples, 2 kg of bananas, 4 kg of oranges was sold on July 03 with total transaction value of 26 €. 3 kg of apples, 1 kg of bananas, 5 kg of oranges was sold on July 04 with total transaction value of 31 €. 5 kg of apples, 2 kg of bananas, 1 kg of oranges was sold on July 05 with total transaction value of 23 €.
<svg class="chart"><rect tabindex="0" aria-label="Apples, 3 kg sold on July 1"></rect><rect tabindex="0" aria-label="Apples, 4 kg sold on July 2"></rect><rect tabindex="0" aria-label="Apples, 3 kg sold on July 3"></rect></svg>
<svg><g class="x axis" aria-hidden="true"></g><g class="y axis" aria-hidden="true"></g>...<rect tabindex="0" aria-label="Apples, 3 kg sold on July 1"></rect><rect tabindex="0" aria-label="Apples, 4 kg sold on July 2"></rect><rect tabindex="0" aria-label="Apples, 3 kg sold on July 3"></rect></svg>
<a href="#target-element">skip chart</a><svg class="chart">...</svg><div id="target-element">...</div>
Lorem ipsum, dolor before consectetur adipisicing elit. Dicta cum amet nisi ipsum eius, repellendus maxime porro vitae corporis.
Placeat sequi nam architecto! Libero officiis after rerum atque, doloribus quos quod.
tabindex=2<body><svg aria-hidden="true"></svg><table class="visually-hidden"></table></body>
.visually-hidden {position: absolute !important;height: 1px;width: 1px;overflow: hidden;clip: rect(1px, 1px, 1px, 1px);}
<body><div class="tabs"><div class="tab"><svg></svg></div><div class="tab"><table></table></div></div></body>
<table><caption>Bob's data</caption><tr><th scope="col">Date</th></tr><tr><th scope="row">Jul 01</th></tr></table>
| Date | Apple | Banana | Orange |
|---|---|---|---|
| Jul 01 | 3 | 3 | 1 |
| Jul 02 | 4 | 3 | 5 |
| Jul 03 | 2 | 2 | 4 |
| Jul 04 | 3 | 1 | 5 |
| Jul 05 | 5 | 2 | 1 |
| Date | Apple | Banana | Orange |
|---|---|---|---|
| Jul 01 | 3 | 1 | 2 |
| Jul 02 | 1 | 5 | 4 |
| Jul 03 | 3 | 4 | 4 |
| Jul 04 | 2 | 5 | 1 |
| Jul 05 | 5 | 2 | 3 |
| Date | Value |
|---|---|
| Jul 01 | 38 |
| Jul 02 | 67 |
| Jul 03 | 59 |
| Jul 04 | 51 |
| Jul 05 | 54 |
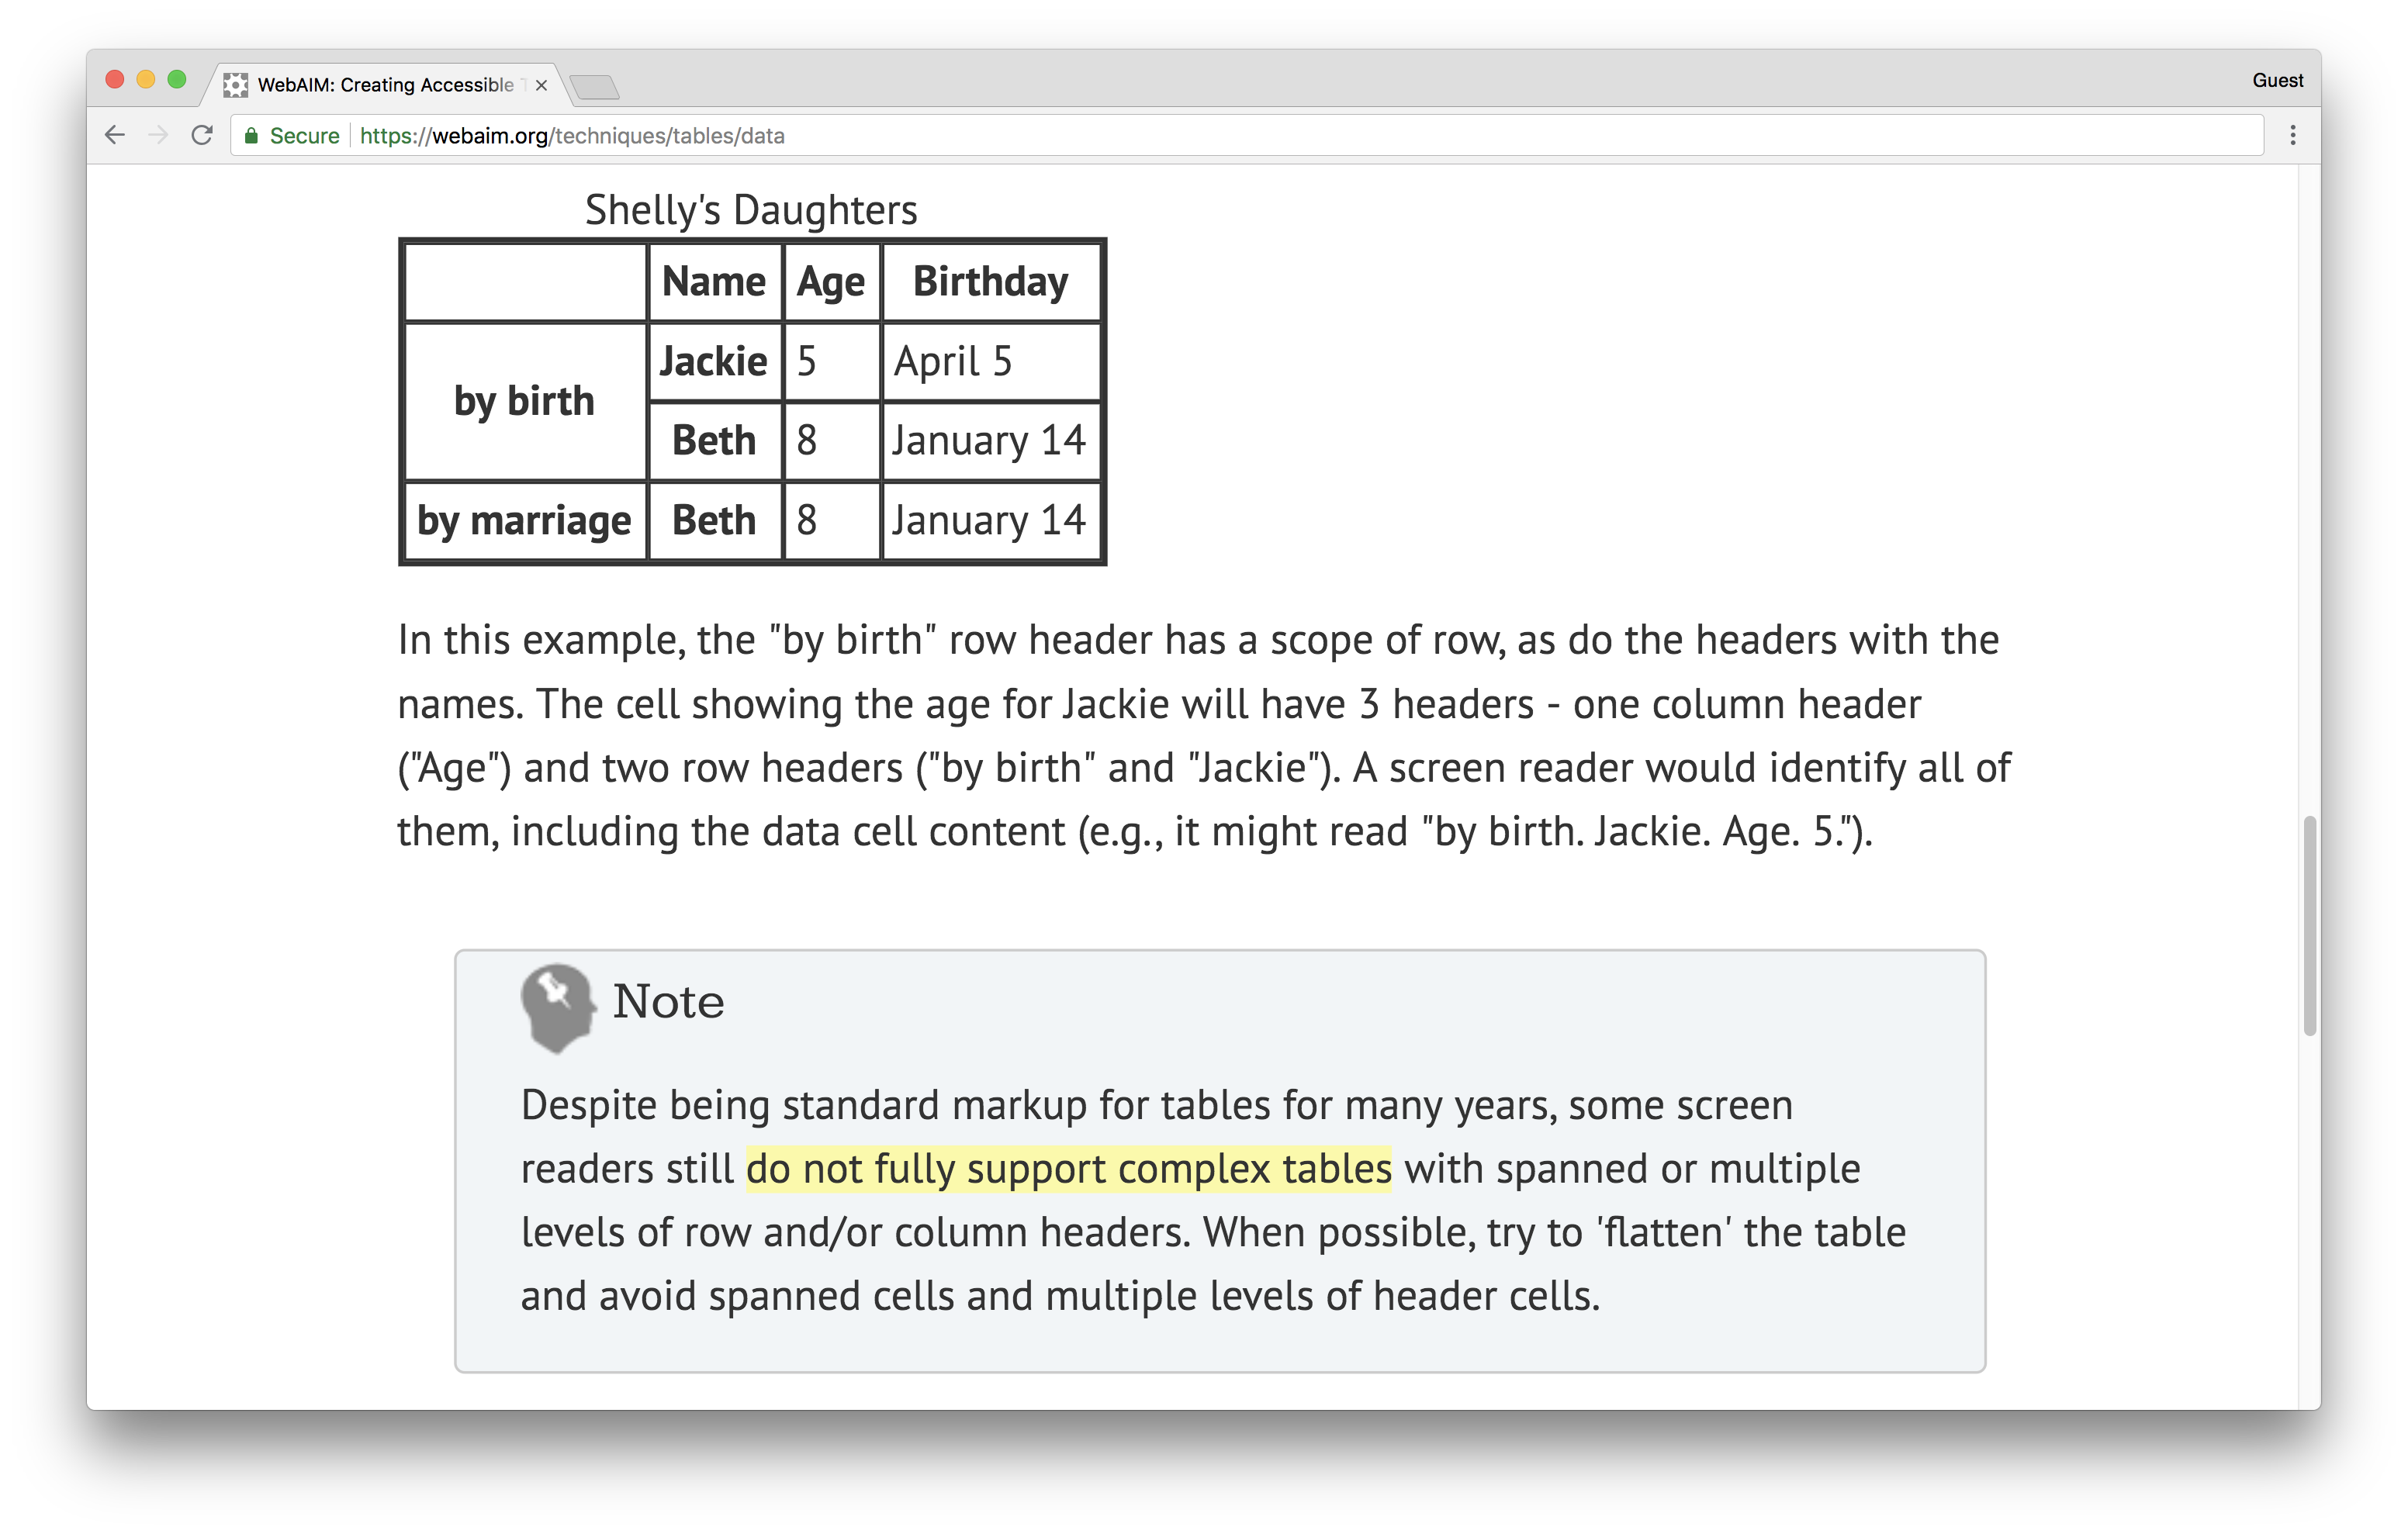
colspan
rowspan
16s 93
248
